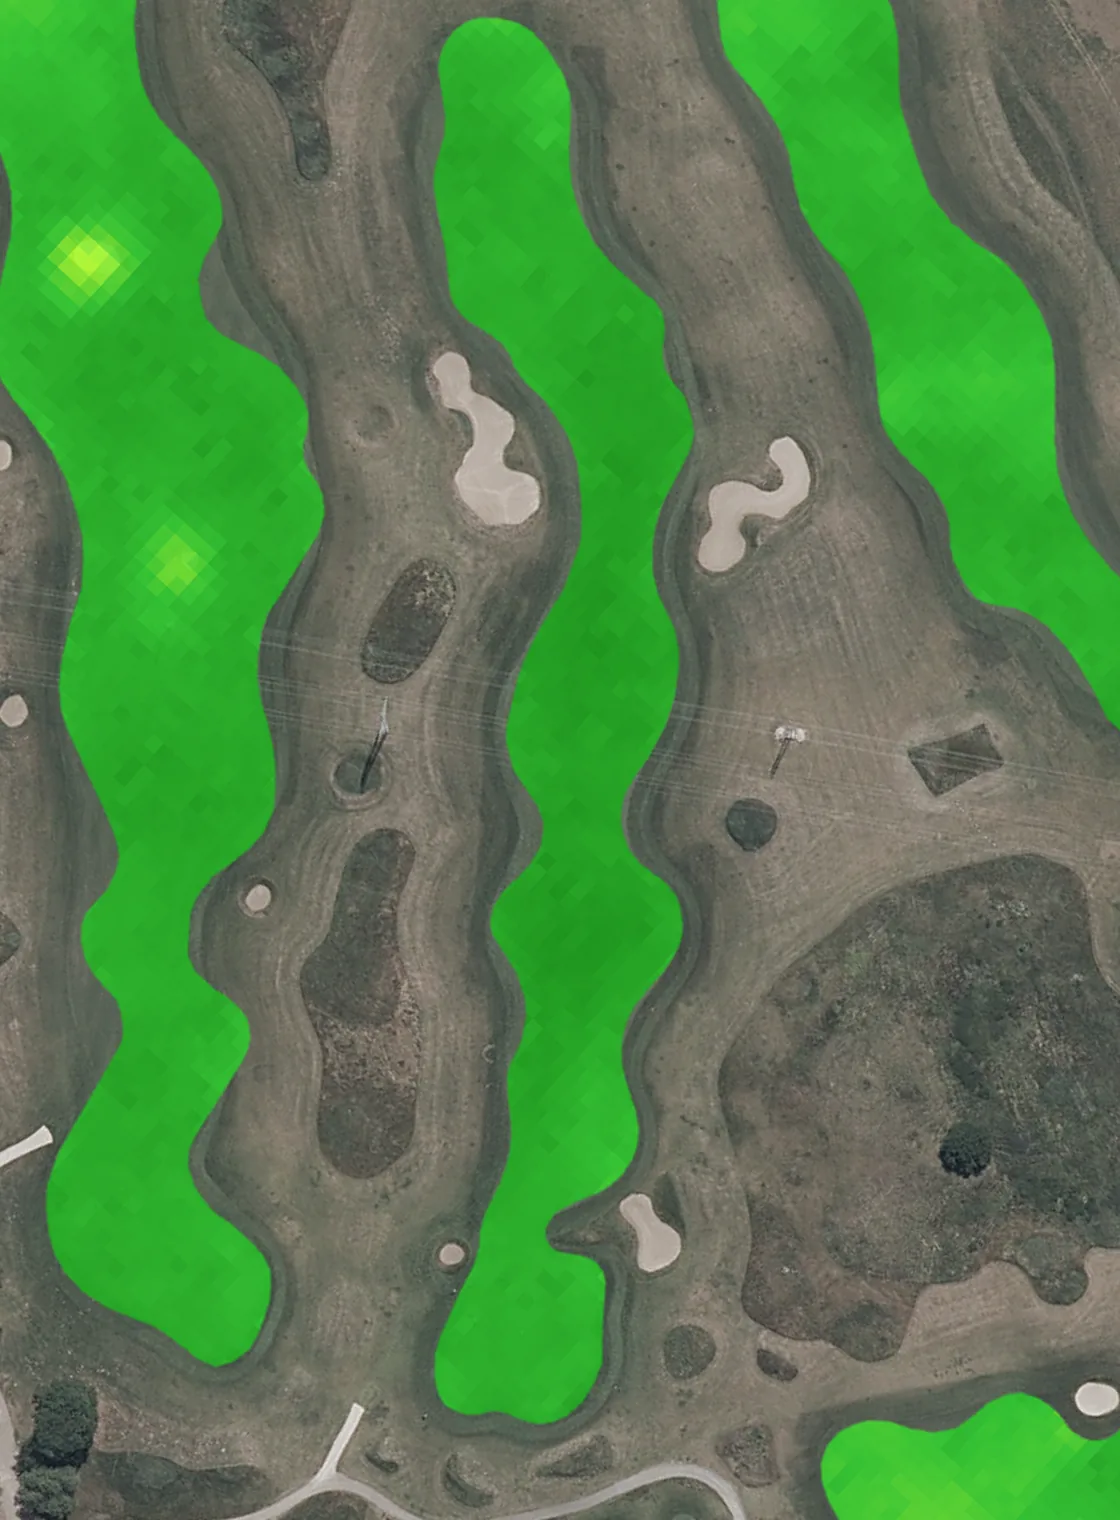
 Same week as today
Fairways coloured by greennessLess greenGreener
1Last year
Every hole is measured against years of its own satellite record, at the same time of year.
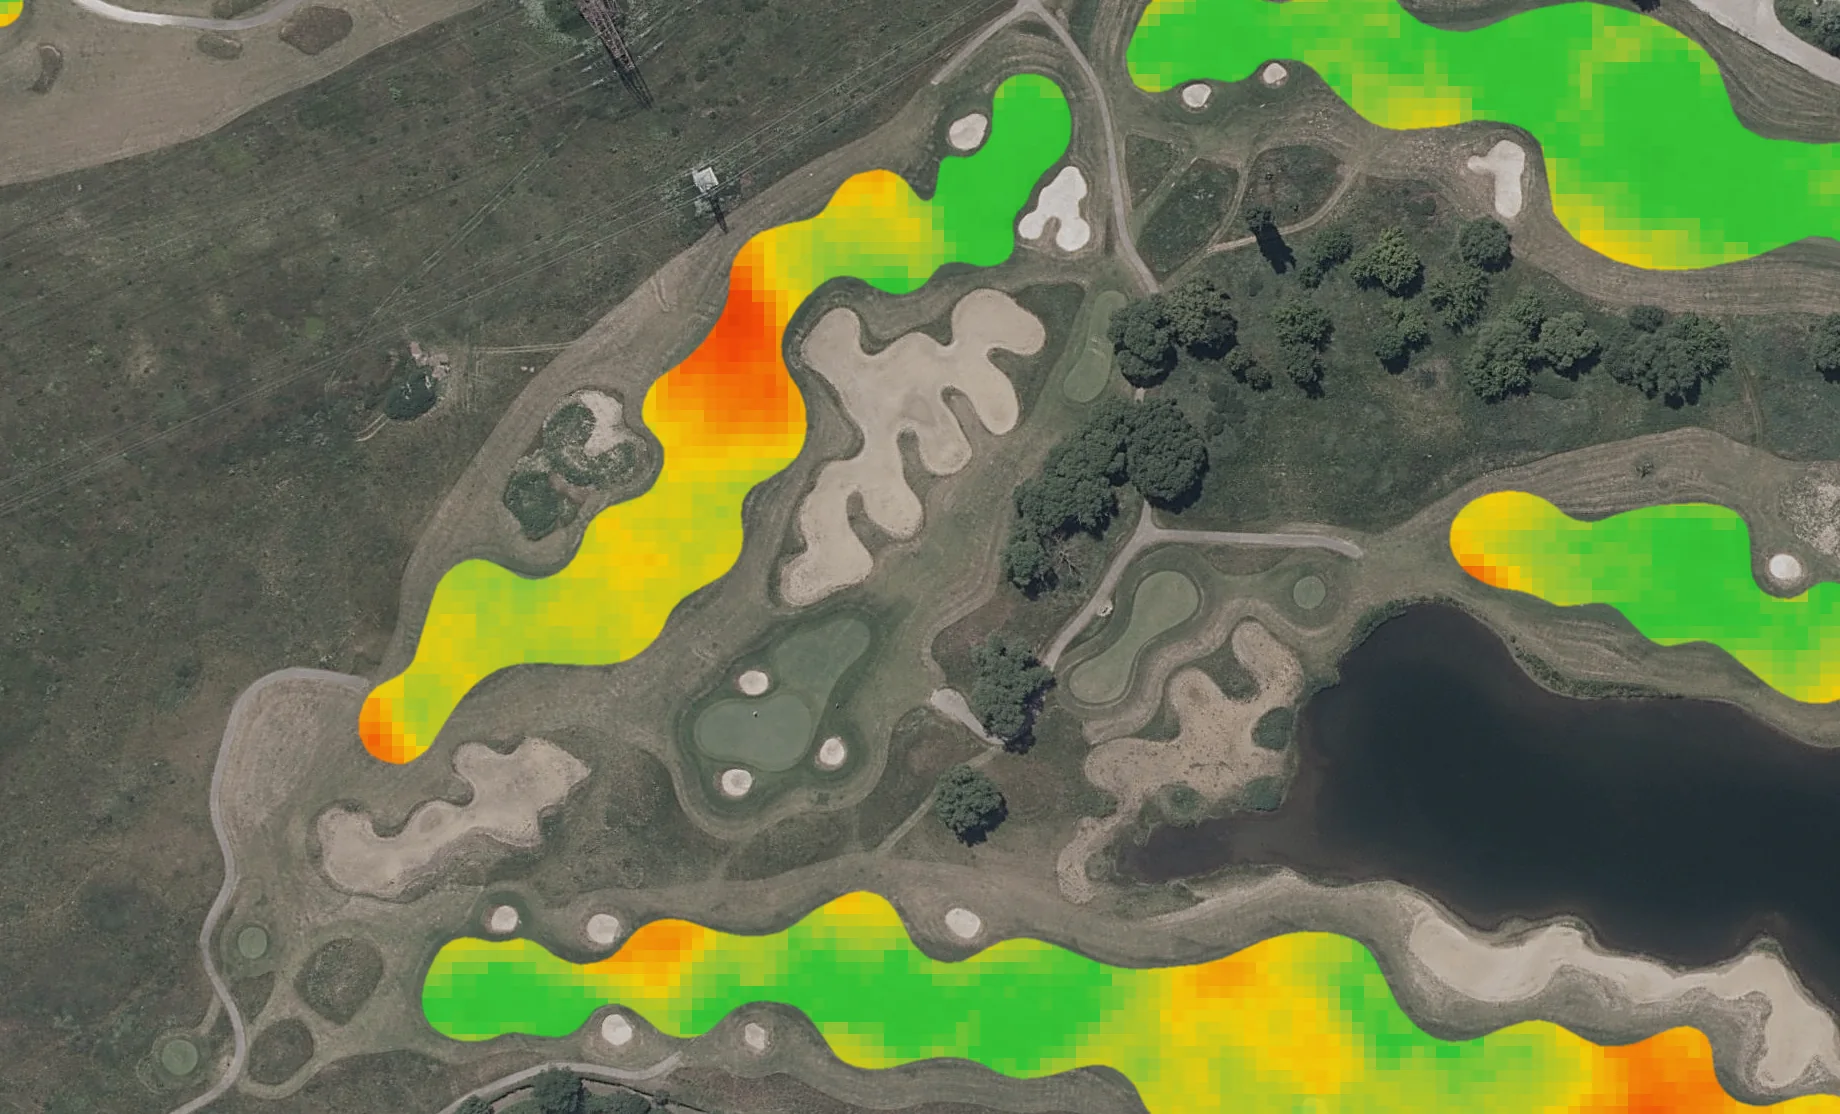
Know which holes need you today, before you walk the course.
Sudden drop in turf greenness, well below this hole’s normal
By the time a problem is plain to see from the cart, it has usually been building for a while.
Nobody can walk every fairway and green every day, and probes only measure single points.
Thin, dry or stressed turf is easy to miss until it spreads or a member points it out.
“The 11th has been struggling since July” is a memory, not evidence you can put in front of an owner or a committee.
Satellite imagery of your course, read hole by hole. No hardware on the course.
Every fairway and green, measured from above. Not a few points with a probe.
Whenever the sky is clear, a short list of the holes that need a look, ready before you walk out.
Each hole’s record over time and the work you logged, ready for an owner or a committee.
Problems caught before members notice them, crew time spent where it is needed, and a season-by-season record of the course to show the board.
Not with the course average, and not with someone else's course. A hole gets flagged when it drops below what is normal for it at this time of year.
Not with the course average, and not with someone else's course. A hole gets flagged when it drops below what is normal for it at this time of year.
Same week as todayEvery hole is measured against years of its own satellite record, at the same time of year.
 Paler across most of the fairway
Paler than the same week last year. That alone could still be normal for this hole.
 Below this hole’s own normal
Only a real drop below the hole’s own normal is flagged, so a hole that is always a little pale stays quiet.
Plans
From weekly oversight of one course to daily, green-level monitoring across several. Try it free for a month.
The team
Over 10 years of combined experience turning satellite data into practical insights.